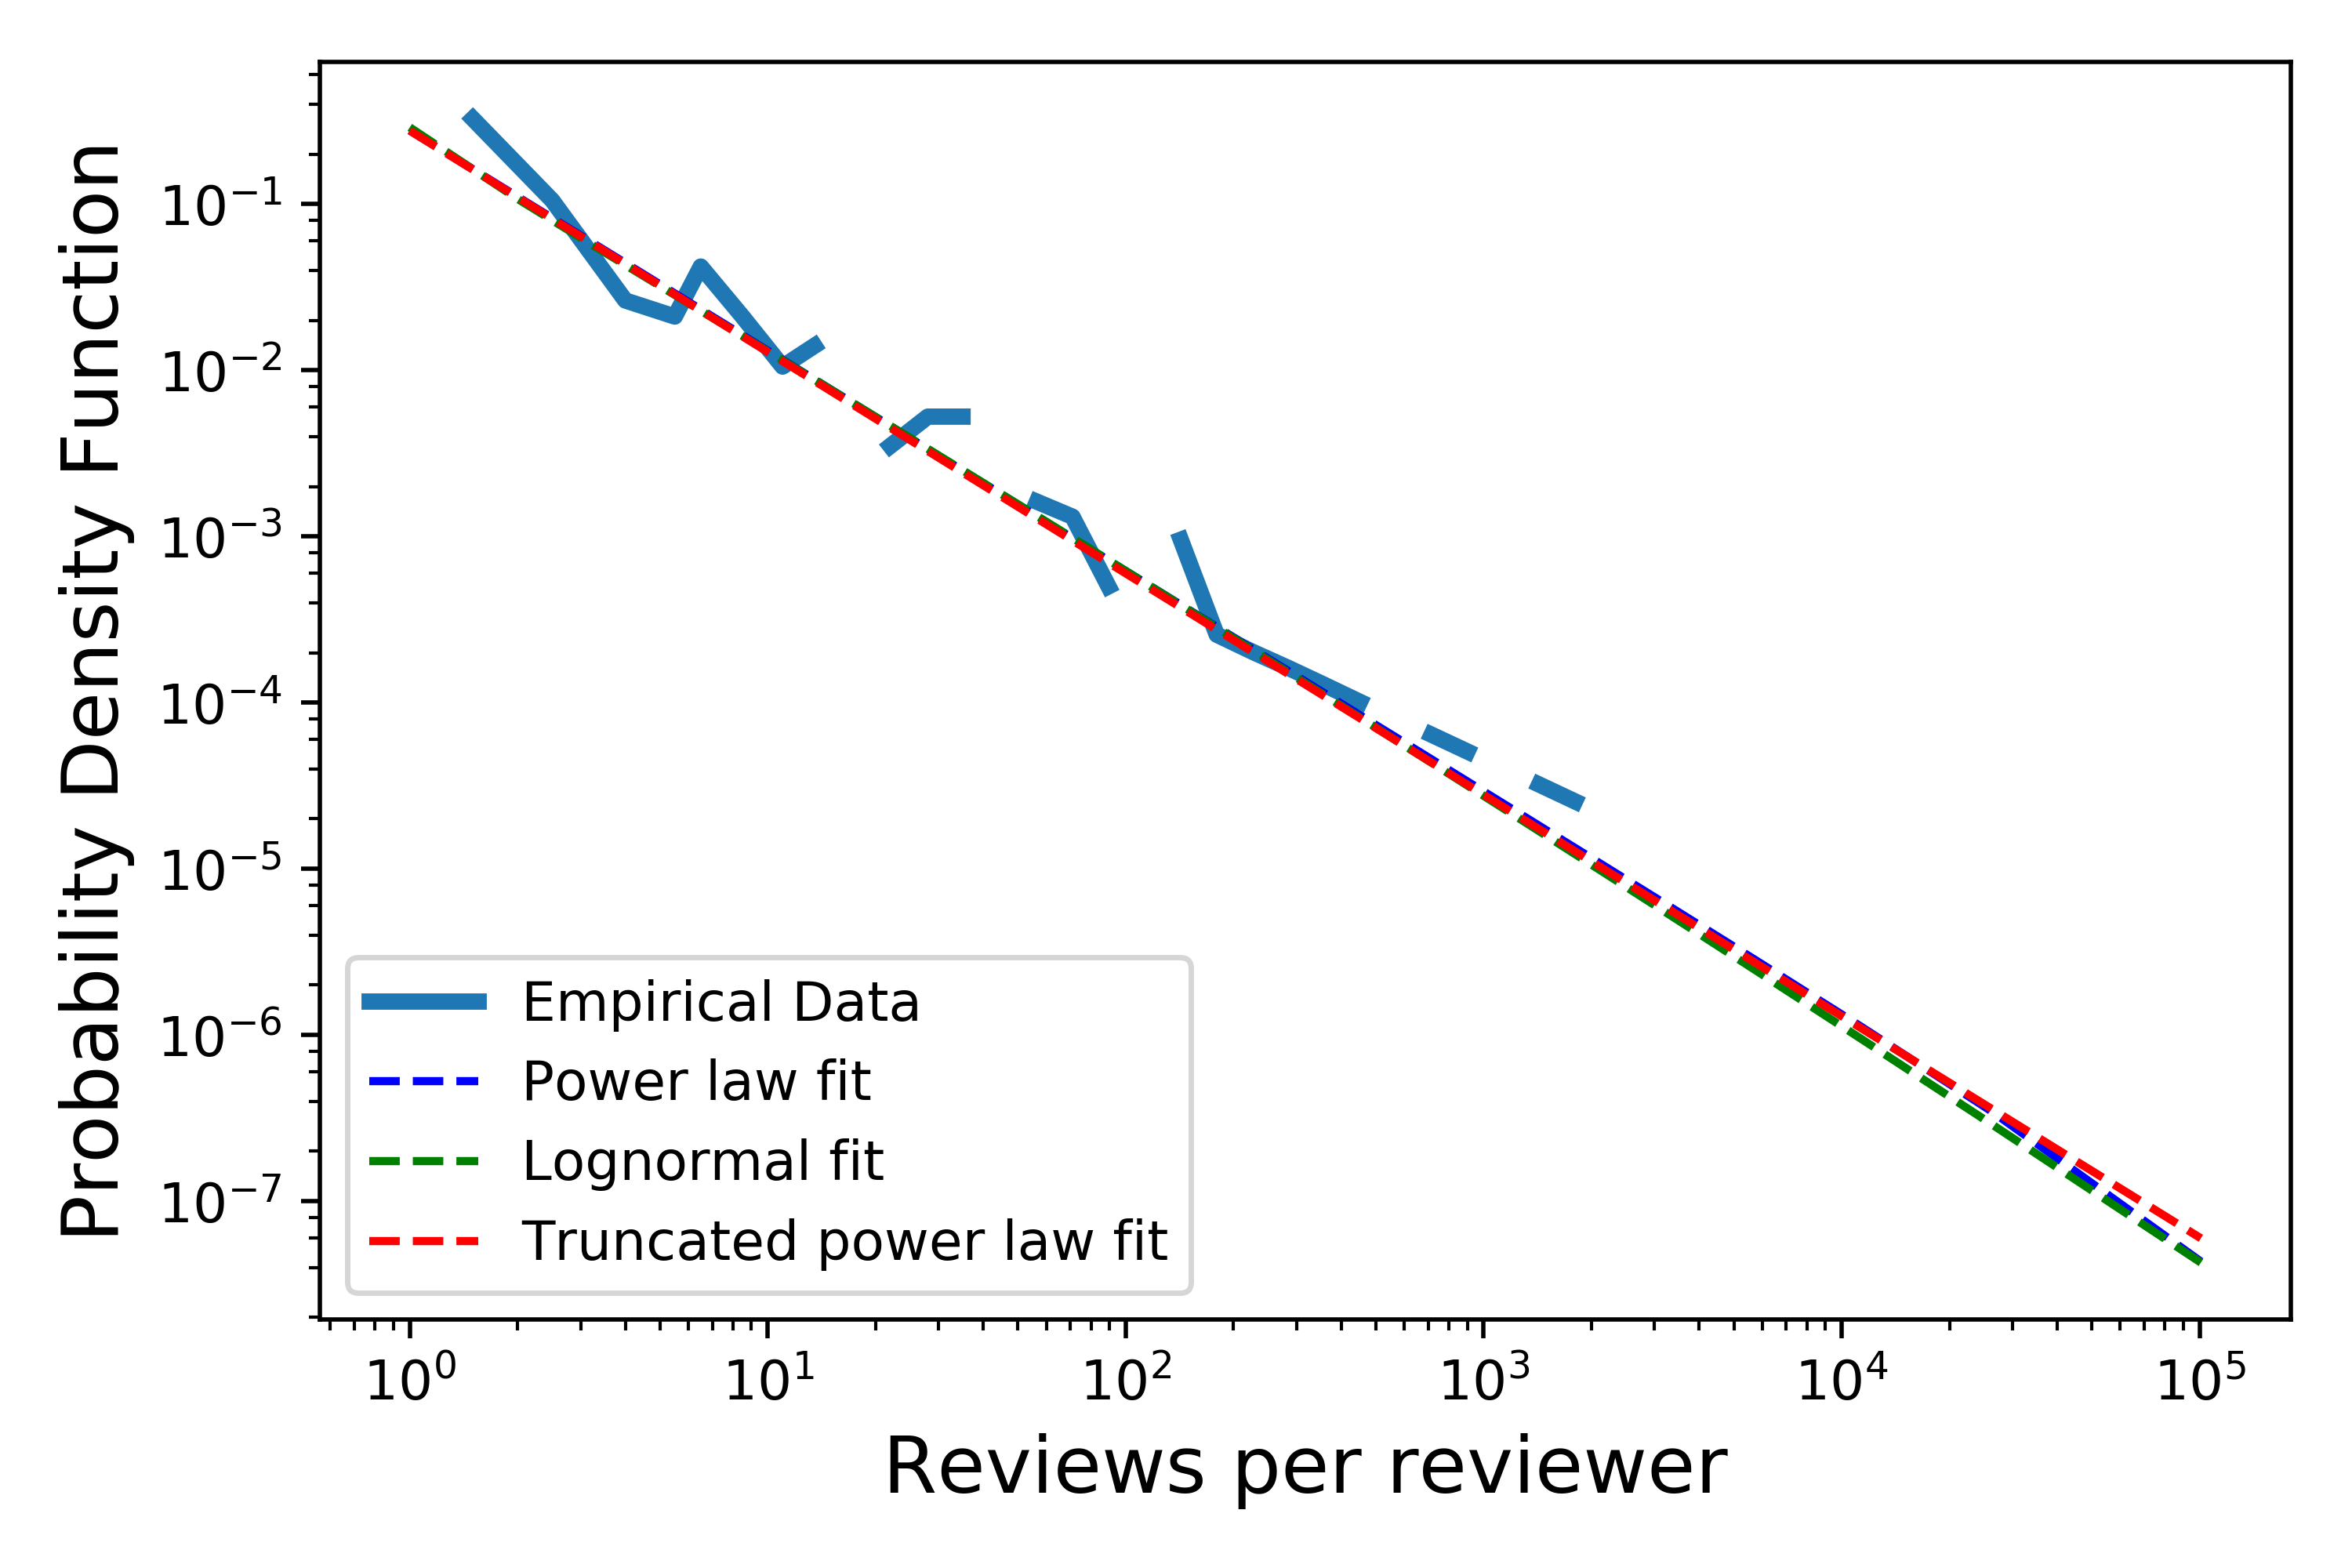
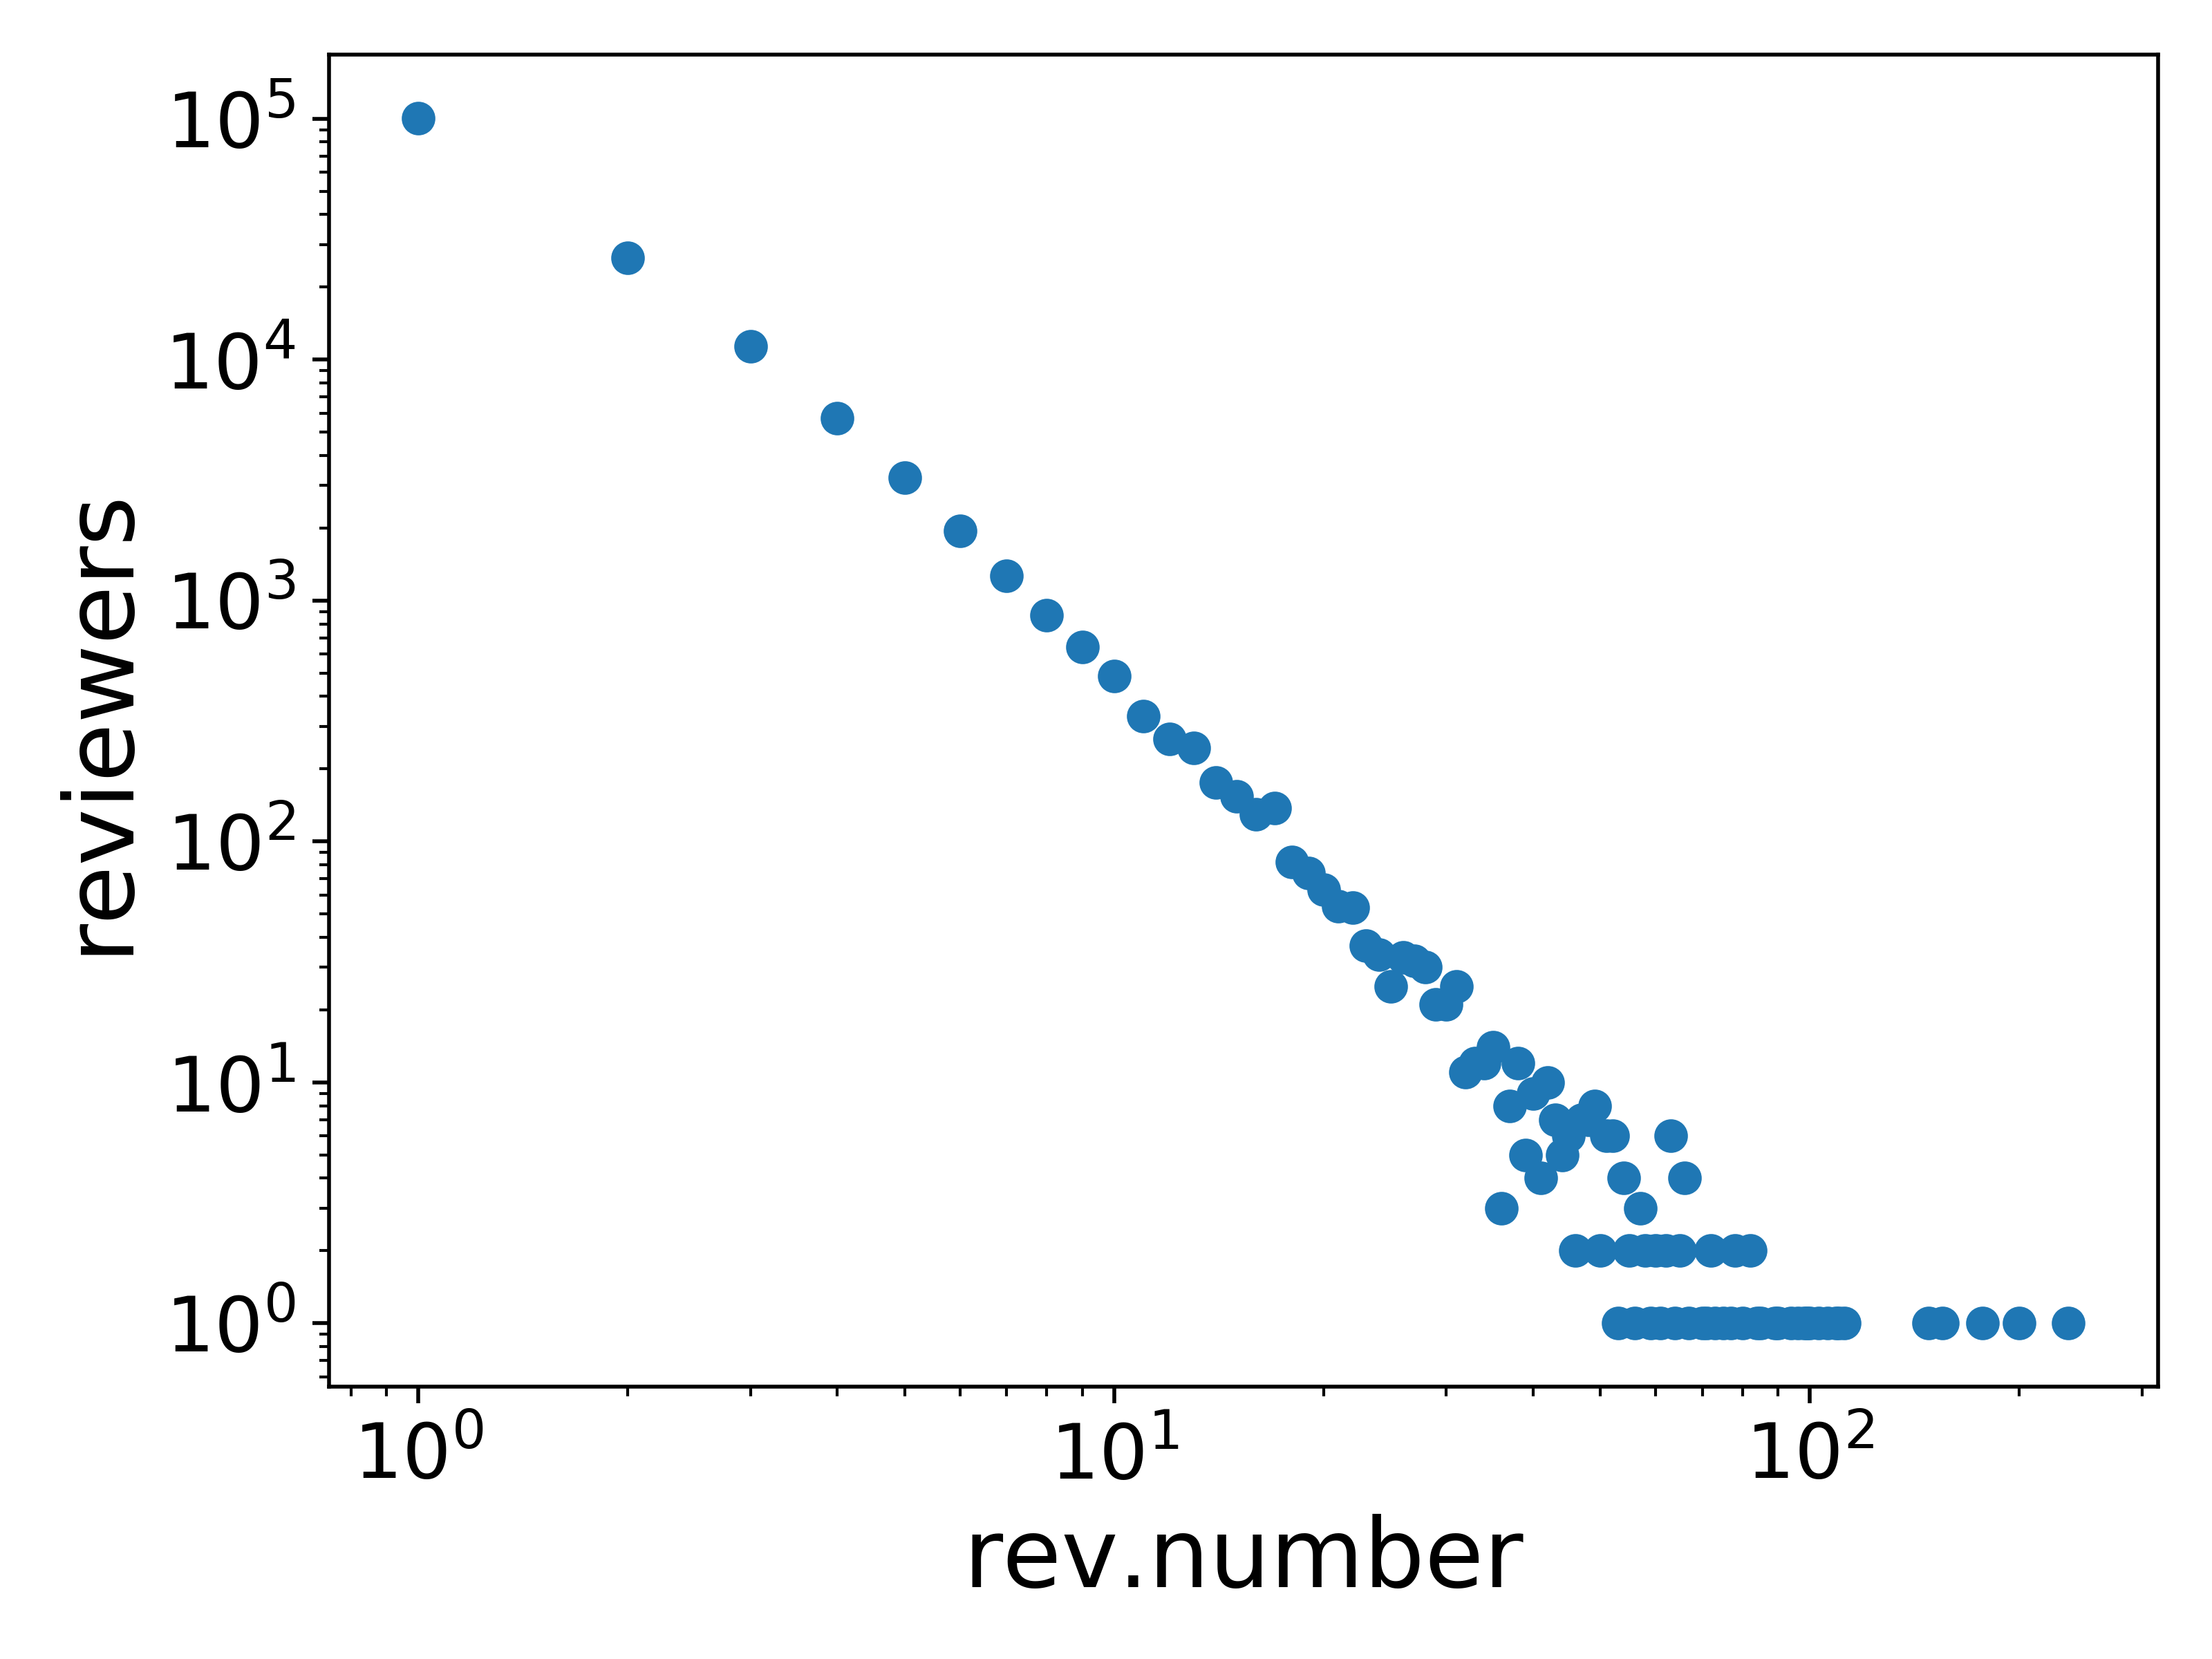
Analysis of the number of reviews per reviewer.
The following graph shows the distribution of the number of reviews per reviewer.
We fitted the data using the following distributions: exponential, power law, truncated power law and lognorm. The best results were provided by the truncated power law and lognormal distributions.